| |
|
|
|
|
|
|
|
|
|
|
|

|
|
|
|
|
|
|
|
|
|
|
|
| |
|
|
|
|
|
|
|
|
|
|
|
| |
|
|

|
|
|
|
|
|
|
|
|
| |
|
|
|
|
|
|
|
|
|
|
|
| |
|
|
|
|
|
|
|
|
|
|
|
| |
|
|
|
|
|
|
|
|
|
|
|
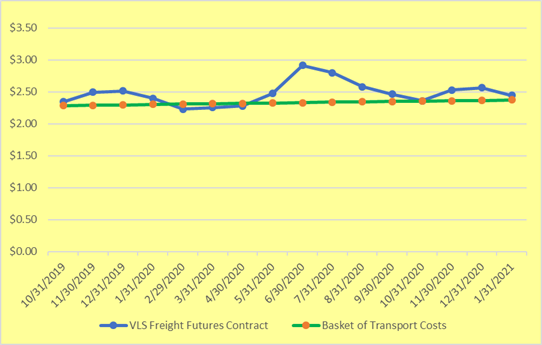
| VLS
Van-Los Angeles to Seattle |
*Freight Future Contract |
*Basket of Costs |
|
VLS Freight Future Contract compared to Basket of
Transport Costs |
|
| VLS |
10/31/2019 |
2.3422 |
2.285 |
|
|
|
|
|
|
|
|
| VLS |
11/30/2019 |
2.4931 |
2.291 |
|
|
|
|
|
|
|
|
| VLS |
12/31/2019 |
2.5139 |
2.296 |
|
|
|
|
|
|
|
|
| VLS |
1/31/2020 |
2.3975 |
2.302 |
|
|
|
|
|
|
|
|
| VLS |
2/29/2020 |
2.2305 |
2.308 |
|
|
|
|
|
|
|
|
| VLS |
3/31/2020 |
2.2524 |
2.314 |
|
|
|
|
|
|
|
|
| VLS |
4/30/2020 |
2.2800 |
2.319 |
|
|
|
|
|
|
|
|
| VLS |
5/31/2020 |
2.4759 |
2.325 |
|
|
|
|
|
|
|
|
| VLS |
6/30/2020 |
2.9114 |
2.331 |
|
|
|
|
|
|
|
|
| VLS |
7/31/2020 |
2.7996 |
2.337 |
|
|
|
|
|
|
|
|
| VLS |
8/31/2020 |
2.5772 |
2.343 |
|
|
|
|
|
|
|
|
| VLS |
9/30/2020 |
2.4620 |
2.349 |
|
|
|
|
|
|
|
|
| VLS |
10/31/2020 |
2.3595 |
2.355 |
|
|
|
|
|
|
|
|
| VLS |
11/30/2020 |
2.5277 |
2.360 |
|
|
|
|
|
|
|
|
| VLS |
12/31/2020 |
2.5657 |
2.366 |
|
|
|
|
|
|
|
|
| VLS |
1/31/2021 |
2.4436 |
2.372 |
|
|
|
|
|
|
|
|
| *Std Dev |
|
0.1776 |
0.0268 |
|
|
|
|
|
|
|
|
| Avg Cost per Mile |
|
2.477 |
2.328 |
|
|
|
|
|
|
|
|
| |
|
|
|
|
|
|
|
|
|
|
|
| *Basket
of Inflation Adjusted Total Transport Costs |
|
|
|
|
|
|
|
|
|
| *Freight Future Contract adjusted for national average freightb brokerage
markup fees of 15.21% and Diesel Fuel Surcharge not included in DAT
Assessment Index |
|
|
|
|
|
|
|
|
|
|
|
| *Standard Deviation measures how spread out average per-mile
costs are over 16 months. The lower the number, the lower the
volatility. The higher the number, the
greater the volatility . |
|
|
|
| |
|
|
|
|
|
|
|
|
|
|
|
| |
|
|
|
|
|
|
|
|
|
|
|

|
|
|
|
|
|
|
|
|
|
|
|
| |
|
|
|
|
|
|
|
|
|
|
|
| |
|
|

|
|
|
|
|
|
|
|
|
| |
|
|
|
|
|
|
|
|
|
|
|
| |
|
|
|
|
|
|
|
|
|
|
|
| |
|
|
|
|
|
|
|
|
|
|
|
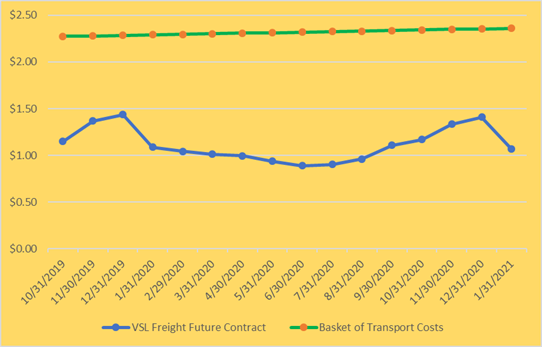
| *VSL-Van
Seattle to Los Angeles |
*Freight Future
Contract |
*Basket
of Costs |
|
VSL Freight Future Contract compared to Basket of
Transport Costs |
|
| VSL |
10/31/2019 |
1.1486 |
2.2740 |
|
|
|
|
|
|
|
|
| VSL |
11/30/2019 |
1.3664 |
2.2797 |
|
|
|
|
|
|
|
|
| VSL |
12/31/2019 |
1.4355 |
2.2854 |
|
|
|
|
|
|
|
|
| VSL |
1/31/2020 |
1.0887 |
2.2911 |
|
|
|
|
|
|
|
|
| VSL |
2/29/2020 |
1.0438 |
2.2968 |
|
|
|
|
|
|
|
|
| VSL |
3/31/2020 |
1.0115 |
2.3026 |
|
|
|
|
|
|
|
|
| VSL |
4/30/2020 |
0.9954 |
2.3083 |
|
|
|
|
|
|
|
|
| VSL |
5/31/2020 |
0.9355 |
2.3141 |
|
|
|
|
|
|
|
|
| VSL |
6/30/2020 |
0.8894 |
2.3199 |
|
|
|
|
|
|
|
|
| VSL |
7/31/2020 |
0.9021 |
2.3257 |
|
|
|
|
|
|
|
|
| VSL |
8/31/2020 |
0.9620 |
2.3315 |
|
|
|
|
|
|
|
|
| VSL |
9/30/2020 |
1.1083 |
2.3373 |
|
|
|
|
|
|
|
|
| VSL |
10/31/2020 |
1.1694 |
2.3432 |
|
|
|
|
|
|
|
|
| VSL |
11/30/2020 |
1.3353 |
2.3490 |
|
|
|
|
|
|
|
|
| VSL |
12/31/2020 |
1.4079 |
2.3549 |
|
|
|
|
|
|
|
|
| VSL |
1/31/2021 |
1.0680 |
2.3608 |
|
|
|
|
|
|
|
|
| *Std Dev |
|
0.1748 |
0.0267 |
|
|
|
|
|
|
|
|
| Avg Cost per Mile |
|
1.0450 |
2.3171 |
|
|
|
|
|
|
|
|
| *The VSL Freight Futures Contract is a
backhaul spot market rate for Van freight from
Seattle to Los Angeles. It should not
be used in a Freight Order Reverse Auction. |
|
|
| *Basket
of Inflation Adjusted Total Transport Costs |
|
|
|
|
| *Freight Future Contract adjusted for national average freightb brokerage
markup fees of 15.21% and Diesel Fuel Surcharge not included in DAT
Assessment Index |
|
|
|
|
|
|
|
|
|
|
|
| *Standard Deviation measures how spread out average per-mile
costs are over 16 months. The lower the number, the lower the
volatility. The higher the number, the
greater the volatility . |
|
|
| |
|
|
|
|
|
|
|
|
|
|
|
| |
|
|
|
|
|
|
|
|
|
|
|

|
|
|
|
|
|
|
|
|
|
|
|
| |
|
|
|
|
|
|
|
|
|
|
|
| |
|
|

|
|
|
|
|
|
|
|
|
| |
|
|
|
|
|
|
|
|
|
|
|
| |
|
|
|
|
|
|
|
|
|
|
|
| |
|
|
|
|
|
|
|
|
|
|
|
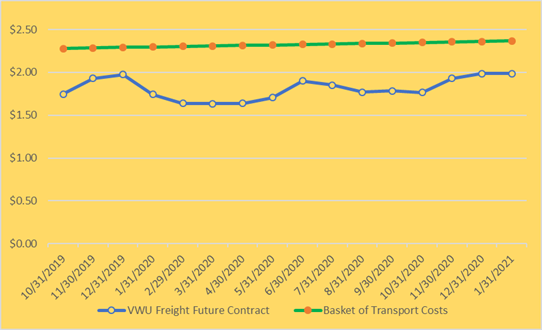
| *VWU
=(VLS + VSL) / 2 |
*Freight Future
Contract |
*Basket
of Costs |
|
VWU Freight Future Contract compared to Basket of
Transport Costs |
|
| VWU |
10/31/2019 |
1.7454 |
2.2795 |
|
|
|
|
|
|
|
|
| VWU |
11/30/2019 |
1.9298 |
2.2852 |
|
|
|
| VWU |
12/31/2019 |
1.9747 |
2.2909 |
|
|
| VWU |
1/31/2020 |
1.7431 |
2.2966 |
|
|
| VWU |
2/29/2020 |
1.6371 |
2.3024 |
|
|
| VWU |
3/31/2020 |
1.6325 |
2.3081 |
|
|
| VWU |
4/30/2020 |
1.6383 |
2.3139 |
|
|
| VWU |
5/31/2020 |
1.7051 |
2.3197 |
|
|
| VWU |
6/30/2020 |
1.8998 |
2.3255 |
|
|
| VWU |
7/31/2020 |
1.8503 |
2.3313 |
|
|
| VWU |
8/31/2020 |
1.7696 |
2.3371 |
|
|
| VWU |
9/30/2020 |
1.7846 |
2.3430 |
|
|
| VWU |
10/31/2020 |
1.7639 |
2.3488 |
|
|
| VWU |
11/30/2020 |
1.9309 |
2.3547 |
|
|
| VWU |
12/31/2020 |
1.9862 |
2.3606 |
|
|
| VWU |
1/31/2021 |
1.9875 |
2.3665 |
|
|
| *Std Dev |
|
0.1233 |
0.0267 |
|
|
| Avg Cost per Mile |
|
1.702 |
2.323 |
|
|
| |
|
|
|
|
|
|
|
|
|
|
|
| *Basket
of Inflation Adjusted Total Transport Costs |
|
|
|
| *Freight Future Contract adjusted for national average freightb brokerage
markup fees of 15.21% and Diesel Fuel Surcharge not included in DAT
Assessment Index |
|
|
|
|
|
|
|
|
|
|
|
| *VWU Freight Futures contract is an average of a VSL headhaul
spot market rate and a VSL backhaul spot market rate. It should not be used in a Freight Order
Reverse Auction. |
|
| *Standard Deviation measures how spread out average per-mile
costs are over 16 months. The lower the number, the lower the
volatility. The higher the number, the
greater the volatility . |
|
|
| |
|
|
|
|
|
|
|
|
|
|
|
| |
|
|
|
|
|
|
|
|
|
|
|

|
|
|
|
|
|
|
|
|
|
|
|
| |
|
|
|
|
|
|
|
|
|
|
|
| |
|
|

|
|
|
|
|
|
|
|
|
| |
|
|
|
|
|
|
|
|
|
|
|
| |
|
|
|
|
|
|
|
|
|
|
|
| |
|
|
|
|
|
|
|
|
|
|
|
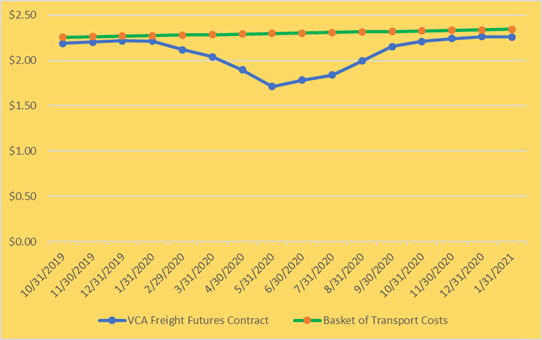
| VCA-Van
Chicago to Atlanta |
*Freight Future
Contract |
*Basket
of Costs |
|
VCA Freight Future Contract compared to Basket of
Transport Costs |
|
| VCA |
10/31/2019 |
2.1890 |
2.2577 |
|
|
|
|
|
|
|
|
| VCA |
11/30/2019 |
2.2017 |
2.2633 |
|
|
|
| VCA |
12/31/2019 |
2.2178 |
2.2690 |
|
|
| VCA |
1/31/2020 |
2.2155 |
2.2747 |
|
|
| VCA |
2/29/2020 |
2.1176 |
2.2804 |
|
|
| VCA |
3/31/2020 |
2.0427 |
2.2861 |
|
|
| VCA |
4/30/2020 |
1.8975 |
2.2918 |
|
|
| VCA |
5/31/2020 |
1.7120 |
2.2975 |
|
|
| VCA |
6/30/2020 |
1.7835 |
2.3033 |
|
|
| VCA |
7/31/2020 |
1.8399 |
2.3090 |
|
|
| VCA |
8/31/2020 |
1.9954 |
2.3148 |
|
|
| VCA |
9/30/2020 |
2.1533 |
2.3206 |
|
|
| VCA |
10/31/2020 |
2.2109 |
2.3264 |
|
|
| VCA |
11/30/2020 |
2.2431 |
2.3322 |
|
|
| VCA |
12/31/2020 |
2.2627 |
2.3380 |
|
|
| VCA |
1/31/2021 |
2.2593 |
2.3439 |
|
|
| *Std Dev |
|
0.1772 |
0.0265 |
|
|
| Avg Cost per Mile |
|
2.084 |
2.301 |
|
|
| |
|
|
|
|
|
| *Basket
of Inflation Adjusted Total Transport Costs |
|
|
|
|
| *Freight Future Contract adjusted for national average freightb brokerage
markup fees of 15.21% and Diesel Fuel Surcharge not included in DAT
Assessment Index |
|
|
|
|
|
|
|
|
|
|
|
| *Standard Deviation measures how spread out average per-mile
costs are over 16 months. The lower the number, the lower the
volatility. The higher the number, the
greater the volatility . |
|
|
| |
|
|
|
|
|
|
|
|
|
|
|
| |
|
|
|
|
|
|
|
|
|
|
|
|
|
|
|
|
|
|
|
|
|
|
|
|
| |
|
|
|
|
|
|
|
|
|
|
|
| |
|
|

|
|
|
|
|
|
|
|
|
| |
|
|
|
|
|
|
|
|
|
|
|
| |
|
|
|
|
|
|
|
|
|
|
|
| |
|
|
|
|
|
|
|
|
|
|
|
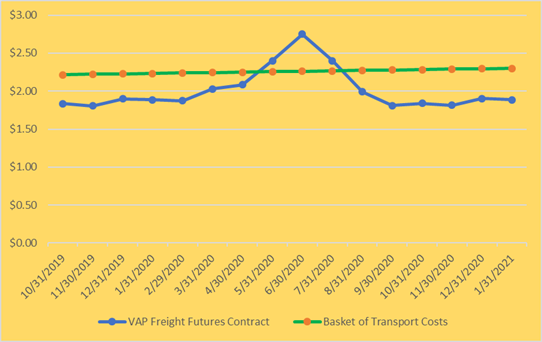
| VAP-Van
Atlanta to Philidelphia |
*Freight Future
Contract |
*Basket
of Costs |
|
VAP Freight Future Contract compared to Basket of
Transport Costs |
|
| VAP |
10/31/2019 |
1.8376 |
2.2162 |
|
|
|
| VAP |
11/30/2019 |
1.8053 |
2.2217 |
|
|
| VAP |
12/31/2019 |
1.9010 |
2.2273 |
|
|
| VAP |
1/31/2020 |
1.8848 |
2.2329 |
|
|
| VAP |
2/29/2020 |
1.8733 |
2.2384 |
|
|
| VAP |
3/31/2020 |
2.0312 |
2.2440 |
|
|
| VAP |
4/30/2020 |
2.0830 |
2.2497 |
|
|
| VAP |
5/31/2020 |
2.3987 |
2.2553 |
|
|
| VAP |
6/30/2020 |
2.7501 |
2.2609 |
|
|
| VAP |
7/31/2020 |
2.3998 |
2.2666 |
|
|
| VAP |
8/31/2020 |
1.9931 |
2.2722 |
|
|
| VAP |
9/30/2020 |
1.8099 |
2.2779 |
|
|
| VAP |
10/31/2020 |
1.8388 |
2.2836 |
|
|
| VAP |
11/30/2020 |
1.8157 |
2.2893 |
|
|
| VAP |
12/31/2020 |
1.9033 |
2.2950 |
|
|
| VAP |
1/31/2021 |
1.8871 |
2.3008 |
|
|
| *Std Dev |
|
0.2632 |
0.0260 |
|
|
| Avg Cost per Mile |
|
2.013 |
2.258 |
|
|
| |
|
|
|
|
|
|
|
|
|
|
|
| *Basket
of Inflation Adjusted Total Transport Costs |
|
|
|
|
| *Freight Future Contract adjusted for national average freightb brokerage
markup fees of 15.21% and Diesel Fuel Surcharge not included in DAT
Assessment Index |
|
|
|
|
|
|
|
|
|
|
|
| *Standard Deviation measures how spread out average per-mile
costs are over 16 months. The lower the number, the lower the
volatility. The higher the number, the
greater the volatility . |
|
|
| |
|
|
|
|
|
|
|
|
|
|
|
| |
|
|
|
|
|
|
|
|
|
|
|
|
|
|
|
|
|
|
|
|
|
|
|
|
| |
|
|
|
|
|
|
|
|
|
|
|
| |
|
|

|
|
|
|
|
|
|
|
|
| |
|
|
|
|
|
|
|
|
|
|
|
| |
|
|
|
|
|
|
|
|
|
|
|
| |
|
|
|
|
|
|
|
|
|
|
|
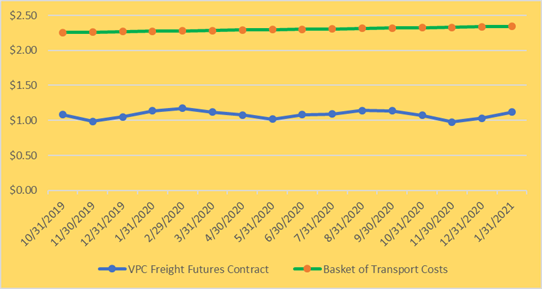
| VPC-Van
Philidelphia to Chicago |
*Freight Future
Contract |
*Basket
of Costs |
|
VPC Freight Future Contract compared to Basket of
Transport Costs |
|
| VPC |
10/31/2019 |
1.0818 |
2.2556 |
|
|
|
|
|
|
|
|
| VPC |
11/30/2019 |
0.9862 |
2.2612 |
|
|
|
| VPC |
12/31/2019 |
1.0484 |
2.2669 |
|
|
| VPC |
1/31/2020 |
1.1383 |
2.2726 |
|
|
| VPC |
2/29/2020 |
1.1717 |
2.2782 |
|
|
| VPC |
3/31/2020 |
1.1164 |
2.2839 |
|
|
| VPC |
4/30/2020 |
1.0795 |
2.2896 |
|
|
| VPC |
5/31/2020 |
1.0185 |
2.2954 |
|
|
| VPC |
6/30/2020 |
1.0830 |
2.3011 |
|
|
| VPC |
7/31/2020 |
1.0910 |
2.3069 |
|
|
| VPC |
8/31/2020 |
1.1406 |
2.3126 |
|
|
| VPC |
9/30/2020 |
1.1371 |
2.3184 |
|
|
| VPC |
10/31/2020 |
1.0749 |
2.3242 |
|
|
| VPC |
11/30/2020 |
0.9781 |
2.3300 |
|
|
| VPC |
12/31/2020 |
1.0311 |
2.3358 |
|
|
| VPC |
1/31/2021 |
1.1175 |
2.3417 |
|
|
| *Std Dev |
|
0.0548 |
0.0265 |
|
|
|
|
|
|
|
|
| Avg Cost per Mile |
|
1.081 |
2.298 |
|
|
|
|
|
|
|
|
| |
|
|
|
|
|
|
|
|
|
|
|
| *Basket
of Inflation Adjusted Total Transport Costs |
|
|
|
|
| *Freight Future Contract adjusted for national average freightb brokerage
markup fees of 15.21% and Diesel Fuel Surcharge not included in DAT
Assessment Index |
|
|
|
|
|
|
|
|
|
|
|
| *Standard Deviation measures how spread out average per-mile
costs are over 16 months. The lower the number, the lower the
volatility. The higher the number, the
greater the volatility . |
|
|
| |
|
|
|
|
|
|
|
|
|
|
|

|
|
|
|
|
|
|
|
|
|
|
|
| |
|
|
|
|
|
|
|
|
|
|
|
| |
|
|

|
|
|
|
|
|
|
|
|
| |
|
|
|
|
|
|
|
|
|
|
|
| |
|
|
|
|
|
|
|
|
|
|
|
| |
|
|
|
|
|
|
|
|
|
|
|
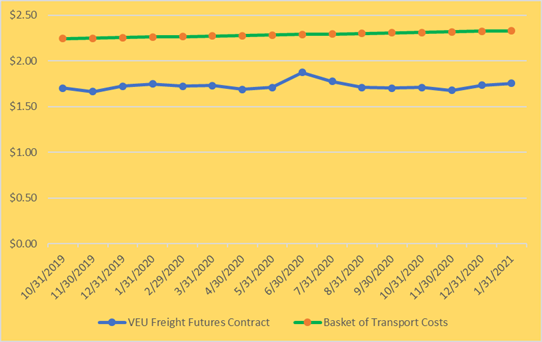
| VEU=
(VCA + VAP + VPC) / 3 |
*Freight Future
Contract |
*Basket
of Costs |
|
VEU Freight Future Contract compared to Basket of
Transport Costs |
|
| VEU |
10/31/2019 |
1.7028 |
2.2432 |
|
|
|
| VEU |
11/30/2019 |
1.6648 |
2.2488 |
|
|
| VEU |
12/31/2019 |
1.7224 |
2.2544 |
|
|
| VEU |
1/31/2020 |
1.7466 |
2.2601 |
|
|
| VEU |
2/29/2020 |
1.7212 |
2.2657 |
|
|
| VEU |
3/31/2020 |
1.7305 |
2.2714 |
|
|
| VEU |
4/30/2020 |
1.6867 |
2.2771 |
|
|
| VEU |
5/31/2020 |
1.7097 |
2.2828 |
|
|
| VEU |
6/30/2020 |
1.8722 |
2.2885 |
|
|
| VEU |
7/31/2020 |
1.7765 |
2.2942 |
|
|
| VEU |
8/31/2020 |
1.7097 |
2.2999 |
|
|
| VEU |
9/30/2020 |
1.7005 |
2.3057 |
|
|
| VEU |
10/31/2020 |
1.7086 |
2.3114 |
|
|
| VEU |
11/30/2020 |
1.6786 |
2.3172 |
|
|
| VEU |
12/31/2020 |
1.7328 |
2.3230 |
|
|
| VEU |
1/31/2021 |
1.7546 |
2.3288 |
|
|
| *Std Dev |
|
0.0467 |
0.0263 |
|
|
| Avg Cost per Mile |
|
1.726 |
2.286 |
|
|
| |
|
|
|
|
|
|
|
|
|
|
|
| *Basket
of Inflation Adjusted Total Transport Costs |
|
|
|
|
| *Freight Future Contract adjusted for national average freightb brokerage
markup fees of 15.21% and Diesel Fuel Surcharge not included in DAT
Assessment Index |
|
|
|
|
|
|
|
|
|
|
|
| *Standard Deviation measures how spread out average per-mile
costs are over 16 months. The lower the number, the lower the
volatility. The higher the number, the
greater the volatility . |
|
|
| |
|
|
|
|
|
|
|
|
|
|
|
| |
|
|
|
|
|
|
|
|
|
|
|

|
|
|
|
|
|
|
|
|
|
|
|
| |
|
|
|
|
|
|
|
|
|
|
|
| |
|
|
|
|
|
|
|
|
|
|
|
| |
|
|
|
|
|
|
|
|
|
|
|
| |
|
|
|
|
|
|
|
|
|
|
|
| |
|
|
|
|
|
|
|
|
|
|
|
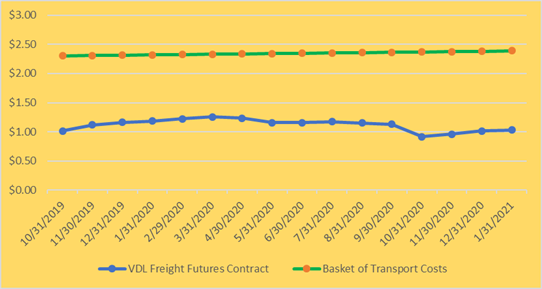
| VDL-Van
Dallas to Los Angeles |
*Freight Future
Contract |
*Basket
of Costs |
|
VDL Freight Future Contract compared to Basket of
Transport Costs |
|
| VDL |
10/31/2019 |
1.0150 |
2.3003 |
|
|
|
|
|
|
|
|
| VDL |
11/30/2019 |
1.1198 |
2.3061 |
|
|
|
| VDL |
12/31/2019 |
1.1648 |
2.3118 |
|
|
| VDL |
1/31/2020 |
1.1878 |
2.3176 |
|
|
| VDL |
2/29/2020 |
1.2247 |
2.3234 |
|
|
| VDL |
3/31/2020 |
1.2581 |
2.3292 |
|
|
| VDL |
4/30/2020 |
1.2339 |
2.3350 |
|
|
| VDL |
5/31/2020 |
1.1567 |
2.3409 |
|
|
| VDL |
6/30/2020 |
1.1567 |
2.3467 |
|
|
| VDL |
7/31/2020 |
1.1740 |
2.3526 |
|
|
| VDL |
8/31/2020 |
1.1509 |
2.3585 |
|
|
| VDL |
9/30/2020 |
1.1314 |
2.3644 |
|
|
| VDL |
10/31/2020 |
0.9194 |
2.3703 |
|
|
| VDL |
11/30/2020 |
0.9620 |
2.3762 |
|
|
| VDL |
12/31/2020 |
1.0138 |
2.3821 |
|
|
| VDL |
1/31/2021 |
1.0346 |
2.3881 |
|
|
| *Std Dev |
|
0.0972 |
0.0270 |
|
|
|
|
|
|
|
|
| Avg Cost per Mile |
|
1.119 |
2.344 |
|
|
|
|
|
|
|
|
| |
|
|
|
|
|
|
|
|
|
|
|
| *Basket
of Inflation Adjusted Total Transport Costs |
|
|
|
|
| *Freight Future Contract adjusted for national average freightb brokerage
markup fees of 15.21% and Diesel Fuel Surcharge not included in DAT
Assessment Index |
|
|
|
|
|
|
|
|
|
|
|
| *Standard Deviation measures how spread out average per-mile
costs are over 16 months. The lower the number, the lower the
volatility. The higher the number, the
greater the volatility . |
|
|
| |
|
|
|
|
|
|
|
|
|
|
|
| |
|
|
|
|
|
|
|
|
|
|
|

|
|
|
|
|
|
|
|
|
|
|
|
| |
|
|
|
|
|
|
|
|
|
|
|
| |
|
|

|
|
|
|
|
|
|
|
|
| |
|
|
|
|
|
|
|
|
|
|
|
| |
|
|
|
|
|
|
|
|
|
|
|
| |
|
|
|
|
|
|
|
|
|
|
|
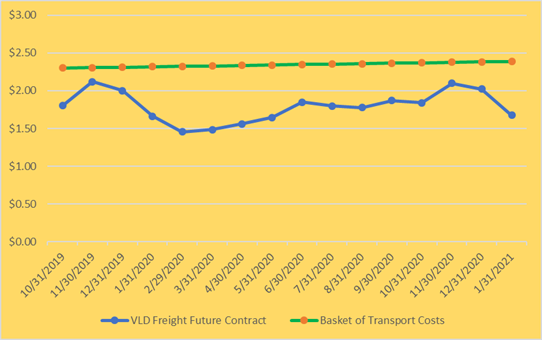
| VLD-Van
Los Angeles to Dallas |
*Freight Future
Contract |
*Basket
of Costs |
|
VLD Freight Future Contract compared to Basket of
Transport Costs |
|
| VLD |
10/31/2019 |
1.8030 |
2.3003 |
|
|
|
|
|
|
|
|
| VLD |
11/30/2019 |
2.1199 |
2.3061 |
|
|
|
| VLD |
12/31/2019 |
2.0035 |
2.3118 |
|
|
| VLD |
1/31/2020 |
1.6613 |
2.3176 |
|
|
| VLD |
2/29/2020 |
1.4551 |
2.3234 |
|
|
| VLD |
3/31/2020 |
1.4839 |
2.3292 |
|
|
| VLD |
4/30/2020 |
1.5599 |
2.3350 |
|
|
| VLD |
5/31/2020 |
1.6464 |
2.3409 |
|
|
| VLD |
6/30/2020 |
1.8480 |
2.3467 |
|
|
| VLD |
7/31/2020 |
1.7961 |
2.3526 |
|
|
| VLD |
8/31/2020 |
1.7754 |
2.3585 |
|
|
| VLD |
9/30/2020 |
1.8722 |
2.3644 |
|
|
| VLD |
10/31/2020 |
1.8399 |
2.3703 |
|
|
| VLD |
11/30/2020 |
2.0980 |
2.3762 |
|
|
| VLD |
12/31/2020 |
2.0231 |
2.3821 |
|
|
| VLD |
1/31/2021 |
1.6763 |
2.3881 |
|
|
| *Std Dev |
|
0.1977 |
0.0270 |
|
|
| Avg Cost per Mile |
|
1.791 |
2.344 |
|
|
| |
|
|
|
|
|
| *Basket
of Inflation Adjusted Total Transport Costs |
|
|
|
|
| *Freight Future Contract adjusted for national average freightb brokerage
markup fees of 15.21% and Diesel Fuel Surcharge not included in DAT
Assessment Index |
|
|
|
|
|
|
|
|
|
|
|
| *Standard Deviation measures how spread out average per-mile
costs are over 16 months. The lower the number, the lower the
volatility. The higher the number, the
greater the volatility . |
|
|
| |
|
|
|
|
|
|
|
|
|
|
|
| |
|
|
|
|
|
|
|
|
|
|
|

|
|
|
|
|
|
|
|
|
|
|
|
| |
|
|
|
|
|
|
|
|
|
|
|
| |
|
|
|
|
|
|
|
|
|
|
|
| |
|
|
|
|
|
|
|
|
|
|
|
| |
|
|
|
|
|
|
|
|
|
|
|
| |
|
|
|
|
|
|
|
|
|
|
|
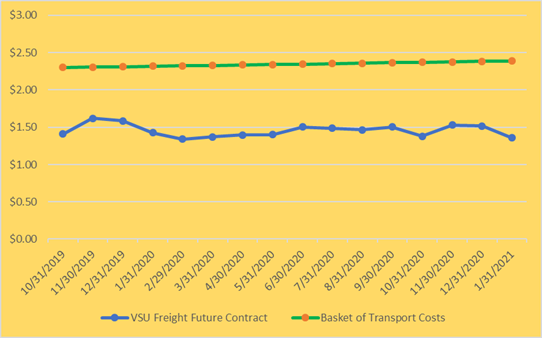
| VSU= (VLD +
VDL) / 2 |
|
*Freight Future
Contract |
*Basket
of Costs |
|
VSU Freight Future Contract compared to Basket of
Transport Costs |
|
| VSU |
10/31/2019 |
1.4090 |
2.3003 |
|
|
|
|
|
|
|
|
| VSU |
11/30/2019 |
1.6199 |
2.3061 |
|
|
|
| VSU |
12/31/2019 |
1.5841 |
2.3118 |
|
|
| VSU |
1/31/2020 |
1.4251 |
2.3176 |
|
|
| VSU |
2/29/2020 |
1.3399 |
2.3234 |
|
|
| VSU |
3/31/2020 |
1.3710 |
2.3292 |
|
|
| VSU |
4/30/2020 |
1.3975 |
2.3350 |
|
|
| VSU |
5/31/2020 |
1.4010 |
2.3409 |
|
|
| VSU |
6/30/2020 |
1.5023 |
2.3467 |
|
|
| VSU |
7/31/2020 |
1.4851 |
2.3526 |
|
|
| VSU |
8/31/2020 |
1.4632 |
2.3585 |
|
|
| VSU |
9/30/2020 |
1.5023 |
2.3644 |
|
|
| VSU |
10/31/2020 |
1.3802 |
2.3703 |
|
|
| VSU |
11/30/2020 |
1.5300 |
2.3762 |
|
|
| VSU |
12/31/2020 |
1.5185 |
2.3821 |
|
|
| VSU |
1/31/2021 |
1.3560 |
2.3881 |
|
|
| *Std Dev |
|
0.0806 |
0.0270 |
|
|
| Avg Cost per Mile |
|
1.455 |
2.344 |
|
|
| |
|
|
|
|
|
|
|
|
|
|
|
| *Basket
of Inflation Adjusted Total Transport Costs |
|
|
|
|
| *Freight Future Contract adjusted for national average freightb brokerage
markup fees of 15.21% and Diesel Fuel Surcharge not included in DAT
Assessment Index |
|
|
|
|
|
|
|
|
|
|
|
| *Standard Deviation measures how spread out average per-mile
costs are over 16 months. The lower the number, the lower the
volatility. The higher the number, the
greater the volatility . |
|
|
| |
|
|
|
|
|
|
|
|
|
|
|
|
|
|
|
|
|
|
|
|
|
|
|
|
| |
|
|
|
|
|
|
|
|
|
|
|
| |
|
|
|
|
|
|
|
|
|
|
|
| |
|
|
|
|
|
|
|
|
|
|
|
| |
|
|
|
|
|
|
|
|
|
|
|
| |
|
|
|
|
|
|
|
|
|
|
|
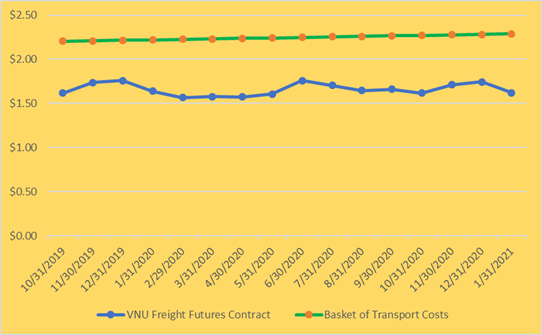
| VNU=
(VWU + VSU + VEU) / 3 |
*Freight Future
Contract |
*Basket
of Costs |
|
VNU Freight Future Contract compared to Basket of
Transport Costs |
|
| VNU |
10/31/2019 |
1.6187 |
2.2036 |
|
|
|
|
|
|
|
|
| VNU |
11/30/2019 |
1.7385 |
2.2091 |
|
|
|
|
|
|
|
|
| VNU |
12/31/2019 |
1.7604 |
2.2146 |
|
|
|
|
|
|
|
|
| VNU |
1/31/2020 |
1.6383 |
2.2202 |
|
|
|
|
|
|
|
|
| VNU |
2/29/2020 |
1.5657 |
2.2257 |
|
|
|
|
|
|
|
|
| VNU |
3/31/2020 |
1.5772 |
2.2313 |
|
|
|
|
|
|
|
|
| VNU |
4/30/2020 |
1.5738 |
2.2369 |
|
|
|
|
|
|
|
|
| VNU |
5/31/2020 |
1.6060 |
2.2425 |
|
|
|
|
|
|
|
|
| VNU |
6/30/2020 |
1.7581 |
2.2481 |
|
|
|
|
|
|
|
|
| VNU |
7/31/2020 |
1.7040 |
2.2537 |
|
|
|
|
|
|
|
|
| VNU |
8/31/2020 |
1.6475 |
2.2593 |
|
|
|
|
|
|
|
|
| VNU |
9/30/2020 |
1.6625 |
2.2650 |
|
|
|
|
|
|
|
|
| VNU |
10/31/2020 |
1.6175 |
2.2706 |
|
|
|
|
|
|
|
|
| VNU |
11/30/2020 |
1.7132 |
2.2763 |
|
|
|
|
|
|
|
|
| VNU |
12/31/2020 |
1.7454 |
2.2820 |
|
|
|
|
|
|
|
|
| VNU |
1/31/2021 |
1.6222 |
2.2877 |
|
|
|
|
|
|
|
|
| *Std Dev |
|
0.0672 |
0.0258 |
|
|
|
|
|
|
|
|
| Avg Cost per Mile |
1.659 |
2.245 |
|
|
|
|
|
|
|
|
| *Basket of Inflation Adjusted Total Transport Costs |
|
|
|
|
| *Freight Future Contract adjusted for national average freightb brokerage
markup fees of 15.21% and Diesel Fuel Surcharge not included in DAT
Assessment Index |
|
|
|
|
|
|
|
|
|
|
|
| *Standard Deviation measures how spread out average per-mile
costs are over 16 months. The lower the number, the lower the
volatility. The higher the number, the
greater the volatility . |
|
|
| |
|
|
|
|
|
|
|
|
|
|
|
| |
|
|
|
|
|
|
|
|
|
|
|
| |
|
|
|
|
|
|
|
|
|
|
|
|
|
|
|
|
|
|
|
|
|
|
|